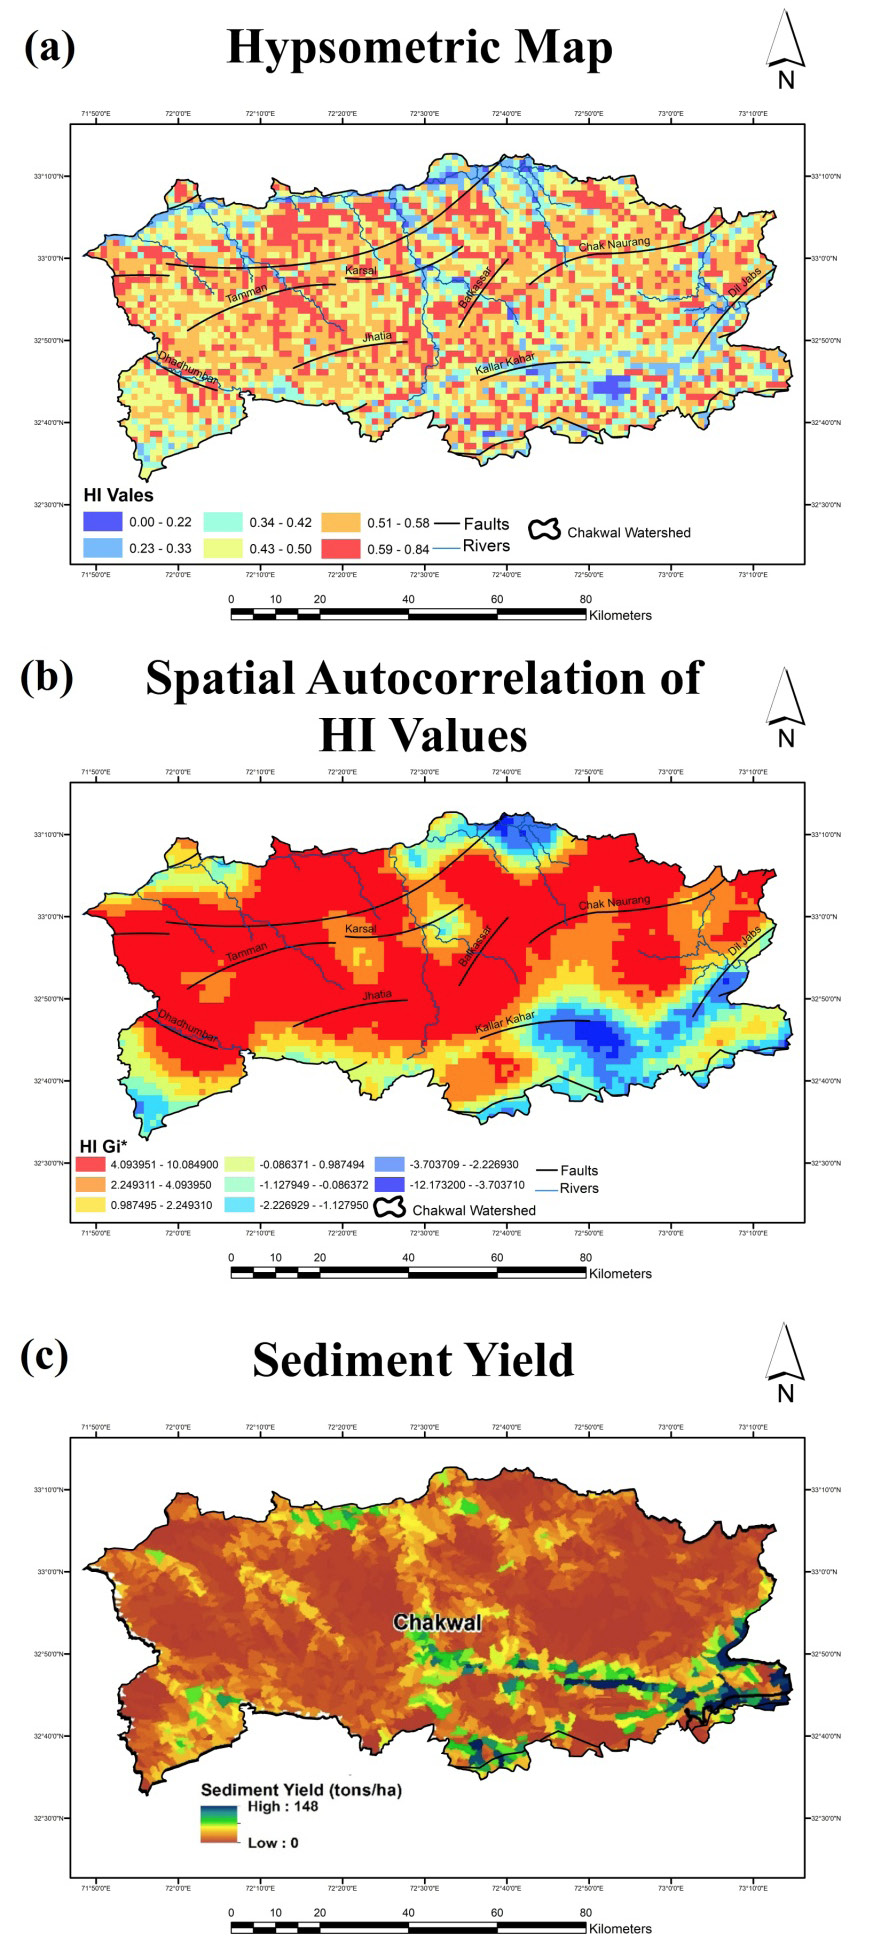
Hypsometric map (a), Spatial auto-correlation map of HI values (b) and Sediment yield for Chakwal district (c).
